


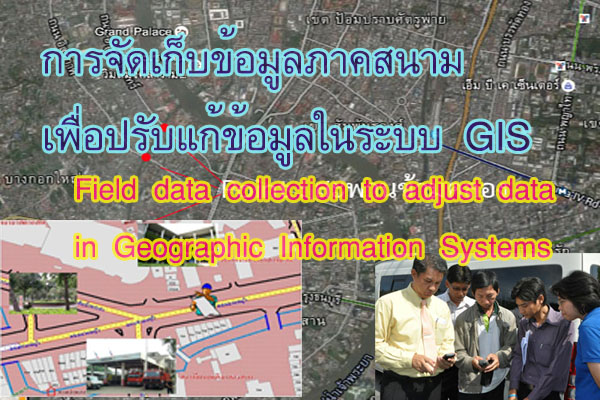
Improving map data in GIS with field data surveys using maps. We need consideration to determine the type of data feature.
Mapping is a representation of the characteristics of the Earth's surface, either globally or in specific regions, achieved through the process of scaling down and using symbols to represent various details present on the terrain. It is crucial to understand the features of a map, which include.
1. Transferring the characteristics of the Earth's surface to a flat plane.
2. Scaling down.
3. Symbols.
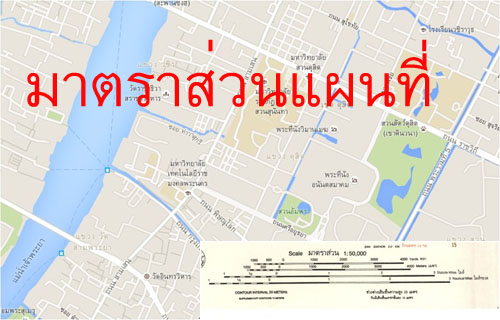
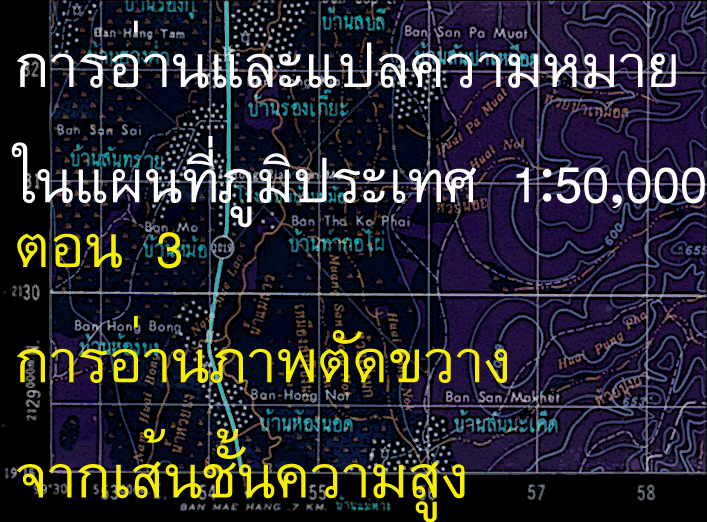
Consequently, it is essential to grasp the importance of recording data on the map throughout all three main components. Understanding minimization or scale is essential for accurately mapping the earth's surface onto a flat map using symbols. In this context, scale represents the ratio between map distances and actual distances on the ground, with the map distance set as 1 unit.
The map scale is 1:1,000, meaning that 1 unit on the map is equal to 1,000 units on the ground. For example:
If it measures 1.2 inches on the map, that's equal to 1.2 x 1,000 inches, or 1,200 inches, which is 100 feet.
If it measures 10 centimeters on the map, that's equal to 10 x 1,000 centimeters, or 10,000 centimeters, which is 1 kilometer.
Improving map data in geographic information systems with field data surveys using maps. We need consideration to determine the type of data feature. The feature type in the country that will be imported into the mapping system, whether in hard copy or digital map format, can be categorized into three main types.
1. Positional Data (Point): Data without dimensions of width and length.
2. Route Data (Line): Data with both length and direction.
3. Area Data (Area/Polygon): Data with dimensions of width, length, and area.
When presenting data in each area, it is necessary to consider comparing it with the size or scale of the base map intended for display or use. For example, when using a base map or map intended for printing with a scale of 1:1,000, determining the feature type is crucial. Here are considerations for feature types when entering data:
1. Telephone Booths: we should set the feature type as Point because the actual size of telephone booths is approximately 1.5 meters in both width and length. If we set the feature type as Polygon, it would require drawing the telephone booth on the map with a width and length of 1.5 millimeters (1 millimeter on the map = 1 meter in reality), making it impractical to draw near the actual location.
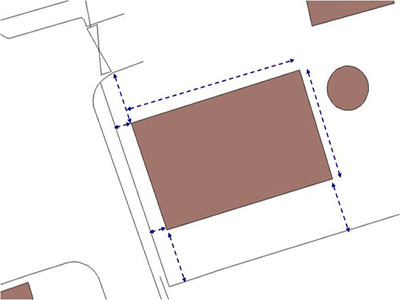
2. Buildings: we should set the feature type as Polygon because most buildings have dimensions, typically ranging from 4 to 6 meters in width. Drawing the building on the map with a width of 4 millimeters is practical and approximates the actual size, so it is not advisable to set the feature type as Point.
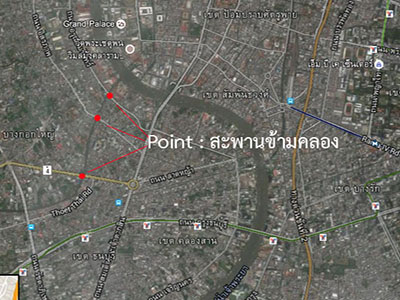
3. Bridge over the canal: we should set the feature type as Line because the Bridge over the canal has a substantial length and width. The total length of a bridge is often more than 5 meters, allowing it to be drawn on the map with a width of 5 millimeters. While the smallest width of a canal cross bridge is maybe 1 to 2 meters, drawing it on the map with a width of 2 millimeters is challenging. Therefore, it is not recommended to set the feature type as Polygon. Usually, the bridges over the canal are represented by their length and the direction they span the canal, making it appropriate to set the feature type as a Line.
However, if the base map or map intended for printing has a scale of 1:10,000, specifying the feature type for the Bridge over the canal as a Point is advisable. In a 1:10,000 scale map, representing a 5-meter bridge length would only be 0.5 millimeters on the map.
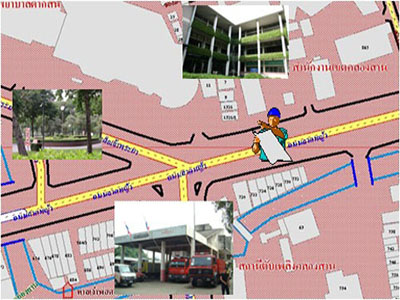
Basic principles regarding field data collection with maps.
Once the feature type of the data has been determined, the field data collection process involves the following steps:
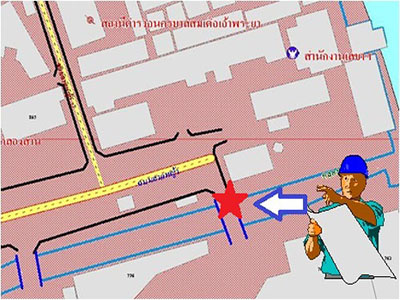
1. Accurately orienting the map's position according to the true geographical direction, as follows:
1.1 If the map has a compass symbol indicating the north, correctly align the map according to the true geographical direction.
1.2 With an incomplete map without a compass symbol, users should observe the actual geographical features and compare them with at least three points on the map. For example, if the district office is to the right, the fire station is to the left, and the hospital is in front of the map user, the user should assume their standing position on the map. If the district office is to the right, the fire station is to the left, and the hospital is in front, the user can then draw the north symbol on the map. Where the actual direction is unknown, users can observe the sun in the morning or evening to approximate east or west. The user can then draw an estimated north symbol on the map by standing with the right-hand facing east and the left-hand facing west, and the front will be considered north.
2. After that, the user can find three points on the map that correspond to the left, right, and front or back of their standing position, and compare them with the actual geographical features.
3. Recording data in the field onto a map. The process of recording data on a map, with knowledge of the scale or proportion of the map, can be easily accomplished. There are basic principles for data recording as follows:
3.1 Know the map scale:
- Calculate the distance in 1 map unit compared to the actual distance on the ground. For example, if the reference map used for data collection has a scale of 1:1,000, it means that 1 centimeter on the map is equivalent to 100 meters.
- Identify reference points and directions on the map.
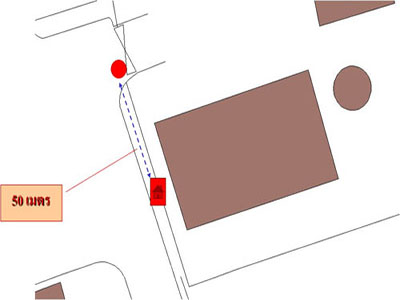
- Position the data, for example, when positioning a telephone booth about 50 meters away from the intersection, which may measure the distance by tape or the step between the points of interest and the points shown on the map.
3.2 Unknown map scale:
Determine the reference distance on the map and in the known actual distance. For example, the length of the road leading to the office building is approximately 100 meters, compared to a map that measures about 1 centimeter. The estimated scale would be 1 centimeter: 100 meters or 1 centimeter: 100 x 100 centimeters. This means that the map has an approximate scale of 1:10,000.
Record the data position as in the case where the scale of the map is known.
4. Record details of the information according to the prepared recording format.
However, in today's modern technology, It is possible to reduce exploration time to create data in the GIS system, but the calculation methods that are stacked in the technology may cause users to not know that the data obtained is too inaccurate to be used.